Introduction
It all started with internet connection problems. Since the end of 2022 I’m using a Raspberry Pi Compute Model 4 with a DFRobot router board as my main internet gateway and router. This proved to be a good decision so far, but after a recent maintenance of my provider I’ve started to have some connection dropouts. A collegue advised me to setup collectd on my OpenWRT router so that I can track connections problems. Collectd is configured in such a way that it pings 8.8.8.8 and 1.1.1.1 to indicate connection problems. While this may not be the perfect solution for proving problems, it was a great start and got me thinking. The metrics and graphs look ok, but in its default configuration the data is lost after a reboot of the router and the graphs aren’t modern enough for my liking. So I’ve thought why can’t I just visualize this data somehow in Grafana, which I’ve already used for other use cases?
Some of the problems
I’ve read that InfluxDB v1 allows a configuration, where its capable of saving collectd data. I’m using InfluxDB v2 where this feature isn’t available anymore.
Another problem is, that I have everything dockerized and need to find a way to get things running in docker. This stackoverflow entry looked promissing but was also only for InfluxDB v1.
So how do I get data out of the OpenWRT collectd?
Telegraf to the rescue
Telegraf is a nice tool provided by InfluxDB to gather various data and transform it in an InfluxDB compatible format. I’ve already used it for gathering data from my Tasmota enabled switches using MQTT.
This Grafana dashboard showed me the solution. There’s an telegraf package for OpenWRT, which can be used as target for the collectd configuration of the OpenWRT. It will transform the data and sends it to my InfluxDB docker container.
Setup a dedicated InfluxDB bucket
Connect to your InfluxDB management website. Go to Load Data, Buckets and create a new bucket. Name it e.g. openwrt-collectd and set the data retention period to 90 days or any other value you prefer.
Next you’ll create a Telegraf configuration. Go to Load Data, Telegraf and create a new configuration. Select the new bucket openwrt-collectd and search for Socket Listener as source. Give it a name and description and paste this content to the configuration:
# Generic socket listener capable of handling multiple socket types.
# see https://grafana.com/grafana/dashboards/18565-openwrt-collectd-flux/
[[inputs.socket_listener]]
  service_address = "udp://:8094"
  data_format = "collectd"
  collectd_security_level = "none"
  collectd_typesdb = ["/usr/share/collectd/types.db"]
  collectd_parse_multivalue = "split"
Once saved, it will show you an API Token. Write it down, since you’ll need it later. You can click on the Telegraf configuration and can download or copy the necessary configuration for the telegraf installation on OpenWRT. Please note that it will reference the INFLUX_TOKEN variable from the environment. I’ve replaced it directly with the token that was generated during the creation of the configuration.
Install and configure collectd on OpenWRT
Connect to your OpenWRT machine and install these packages:
opkg update
opkg install collectd collectd-mod-cpu collectd-mod-df collectd-mod-interface collectd-mod-iwinfo collectd-mod-load collectd-mod-memory collectd-mod-network collectd-mod-ping collectd-mod-rrdtool collectd-mod-thermal collectd-mod-uptime
In LuCi, you’ll see a new menu point called Statistics. Under Setup you can configure all Collectd Settings to your liking. The interesting part is under Output plugins. Configure the Network and add a new Server interface:
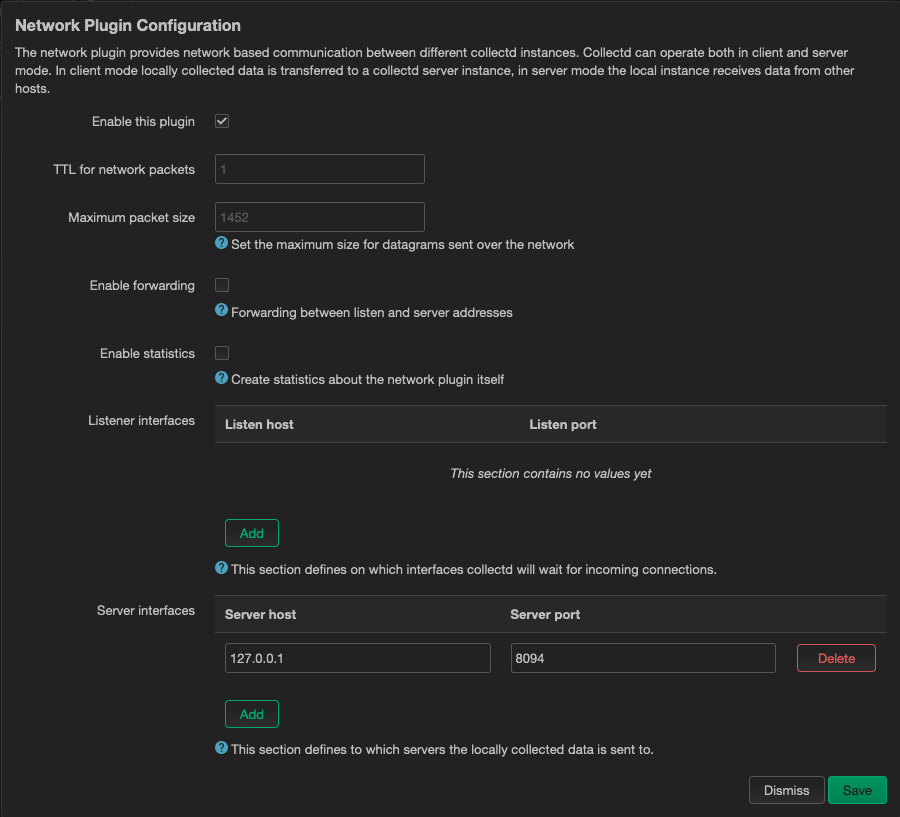
Set it to connect to 127.0.0.1 and port 8094.
Since we’ve setup collectd to use encryption, we’ll have to edit the /etc/collectd.conf manually and change the section for the network plugin to something like this:
<Plugin "network">
  <Server "192.168.0.42">
    SecurityLevel "Encrypt"
    Username "user0"
    Password "foo"
  </Server>
</Plugin>
Restart collectd after you’ve configured it and watch for errors in the System Log viewer of OpenWRT.
Install and configure telegraf on OpenWRT
There are two telegraf packages on OpenWRT. telegraf is smaller and misses some of the supported plugins. I’ve got no space problems, so I’ve installed telegraf-full:
opkg update
opkg install telegraf-full
Telegraf can only be configured by editing the file /etc/telegraf.conf. Search for [[outputs.influxdb_v2]] and configure the urls, token, organization and bucket. Set them accordingly to the access parameters you’ve configured in InfluxDB.
Now search for [[inputs.socket_listener]]. Either reuse the existing commented entry or add a new one, using the content we’ve saved earlier in the buckets creation.
Restart telegraf after you’ve configured it and watch for errors in the System Log viewer of OpenWRT.
Create readonly user for Grafana in InfluxDB
In InfluxDB management console, go to Load Data, API Tokens and generate a new API token. Give it a description and read access to the openwrt-collectd bucket. Make a note of the generated API Token and configure a new Datasource in Grafana.
Go to Grafana console, then Connections, Data sources. Add a new data source of type InfluxDB. If you want to use the existing Grafana dashboard I’ve mentioned earlier, you’ll have to select Flux as Query Language. Use your API token and add it under InfluxDB Details. Click on Save & test and your source should be working.
You can now import the existing Dashboard. It will ask you for a datasource (the one you’ve just created) as well as a monitor:proxmox datasource. I’ve just reused the one I’ve created for the OpenWRT telegraf integration and it seems to be still working.
Conclusion
I’ve got now all collectd from my router in InfluxDB of the last 90 days. I can create connections between several parameters and have some beautiful dashboards to look at. Additionally it proofed to be quite a challenge that needed solving.