Introduction
A few years ago I’ve bought some WiFi enabled power plugs (like these Gosund SP111). I’ve flashed them with Tasmota and want to use them as power meters in my home. Tasmota allows me to connect the power plugs to a MQTT broker like Mosquitto. With MQTT I have a way to control them and to read their sensor data.
I’m already using influxdb in combination with grafana to display other telemetry in my home (e.g. the Fritz!Box data). I now want to use telegraf to write the data from MQTT to the influxdb, so that it can be visualized.
Docker container setup for telegraf
Telegraf docker container
I’m using telegraf on my Synology NAS inside a Docker container. Here’s my docker-compose.yml:
  telegraf:
    hostname: telegraf
    image: telegraf:1.22
    container_name: telegraf
    restart: "unless-stopped"
    volumes:
      - /volume1/docker/telegraf/telegraf.conf:/etc/telegraf/telegraf.conf:ro
    ports:
      - "8092:8092"
      - "8094:8094"
      - "8125:8125"
The telegraf.conf is a huge file that is generated by a single manual start of the docker container. I’ve used these commands to start it one time:
docker run --rm telegraf telegraf config > telegraf/telegraf.conf
It will use the latest telegraf docker container and will write the output to the telegraf/telegraf.conf. I’ve executed this command inside the /volume1/docker/ folder so I was already setup with the right location.
Mosquitto container setup
I’m using mosquitto on my Synology NAS inside a Docker container. Here’s the relevant part of the docker-compose.yml:
mosquitto:
    hostname: mosquitto
    image: eclipse-mosquitto:1.6.15
    container_name: mosquitto
    restart: "unless-stopped"
    volumes:
      - /volume1/docker/mqtt/mosquitto.conf:/mosquitto/config/mosquitto.conf:ro
      - /volume1/docker/mqtt/mosquitto.passwd:/mosquitto/config/mosquitto.passwd
      - /volume1/docker/mqtt/mosquitto.acl:/mosquitto/config/mosquitto.acl
      - /volume1/docker/mqtt/log/mosquitto.log:/mosquitto/log/mosquitto.log
      - /volume1/docker/mqtt/data:/mosquitto/data
    ports:
      - "1883:1883"
The detailed setup and usage of Mosquitto is already explained here.
Telegraf configuration
Open the generated telegraf.conf and search and replace username and password according to your setup. Gabriel Tanner has a great description of the setup I’ve used as starting point.
MQTT
I know that Tasmota writes its sensor data as JSON messages to MQTT. So I specifically configured json as data format so that Telegraf translates the valules properly. This is an example output received on the queue:
{"Time":"2022-04-26T22:33:07","ENERGY":{"TotalStartTime":"2019-12-02T21:15:46","Total":526.612,"Yesterday":1.117,"Today":1.095,"Period": 0,"Power": 0,"ApparentPower": 0,"ReactivePower": 0,"Factor":0.00,"Voltage": 0,"Current":0.000}}
Telegraf will merge the entries of the ENERGY subhash into a single variable, so they will endup as e.g. ENERGY_Today.
# # Read metrics from MQTT topic(s)
[[inputs.mqtt_consumer]]
   servers = ["tcp://ds218plus:1883"]
#   ## Topics that will be subscribed to.
   topics = [
     "tasmota/tele/+/SENSOR"
   ]
#   ## Username and password to connect MQTT server.
   username = "<yourUserHere>"
   password = "<yourPasswordHere>"
#   ## Data format to consume.
#   ## Each data format has its own unique set of configuration options, read
#   ## more about them here:
#   ## https://github.com/influxdata/telegraf/blob/master/docs/DATA_FORMATS_INPUT.md
   data_format = "json"
The username and password need to be the account you’ve configured in Mosquitto. It should have read permissions setup in its ACL to the topic you want to listen to. For use with tasmota power plugs I’m using the topic "tasmota/tele/+/SENSOR" which will use a placeholder and will listen to all my differently named power plugs. Thats what the + is used for.
influxdb
In my case I’ve already setup an influxdb where the metrics should be stored. Its database is called telegraf and the user has the necessary permissions for this database. The skip_database_creation = true is necessary, as otherwise telegraf will try to create the database for you. The creation of a database is described here, while the user permissions are described here.
Since my docker containers use exposed ports, the are reachable under the name/IP of my Synology.
# Configuration for sending metrics to InfluxDB
[[outputs.influxdb]]
  ## The full HTTP or UDP URL for your InfluxDB instance.
  ##
  ## Multiple URLs can be specified for a single cluster, only ONE of the
  ## urls will be written to each interval.
  # urls = ["unix:///var/run/influxdb.sock"]
  # urls = ["udp://127.0.0.1:8089"]
  # urls = ["http://127.0.0.1:8086"]
  urls = ["http://ds218plus:8086"]

  ## The target database for metrics; will be created as needed.
  ## For UDP url endpoint database needs to be configured on server side.
  database = "telegraf"

  ## If true, no CREATE DATABASE queries will be sent.  Set to true when using
  ## Telegraf with a user without permissions to create databases or when the
  ## database already exists.
  skip_database_creation = true

  ## HTTP Basic Auth
  username = "<yourUserHere>"
  password = "<yourPasswordHere>"
Grafana
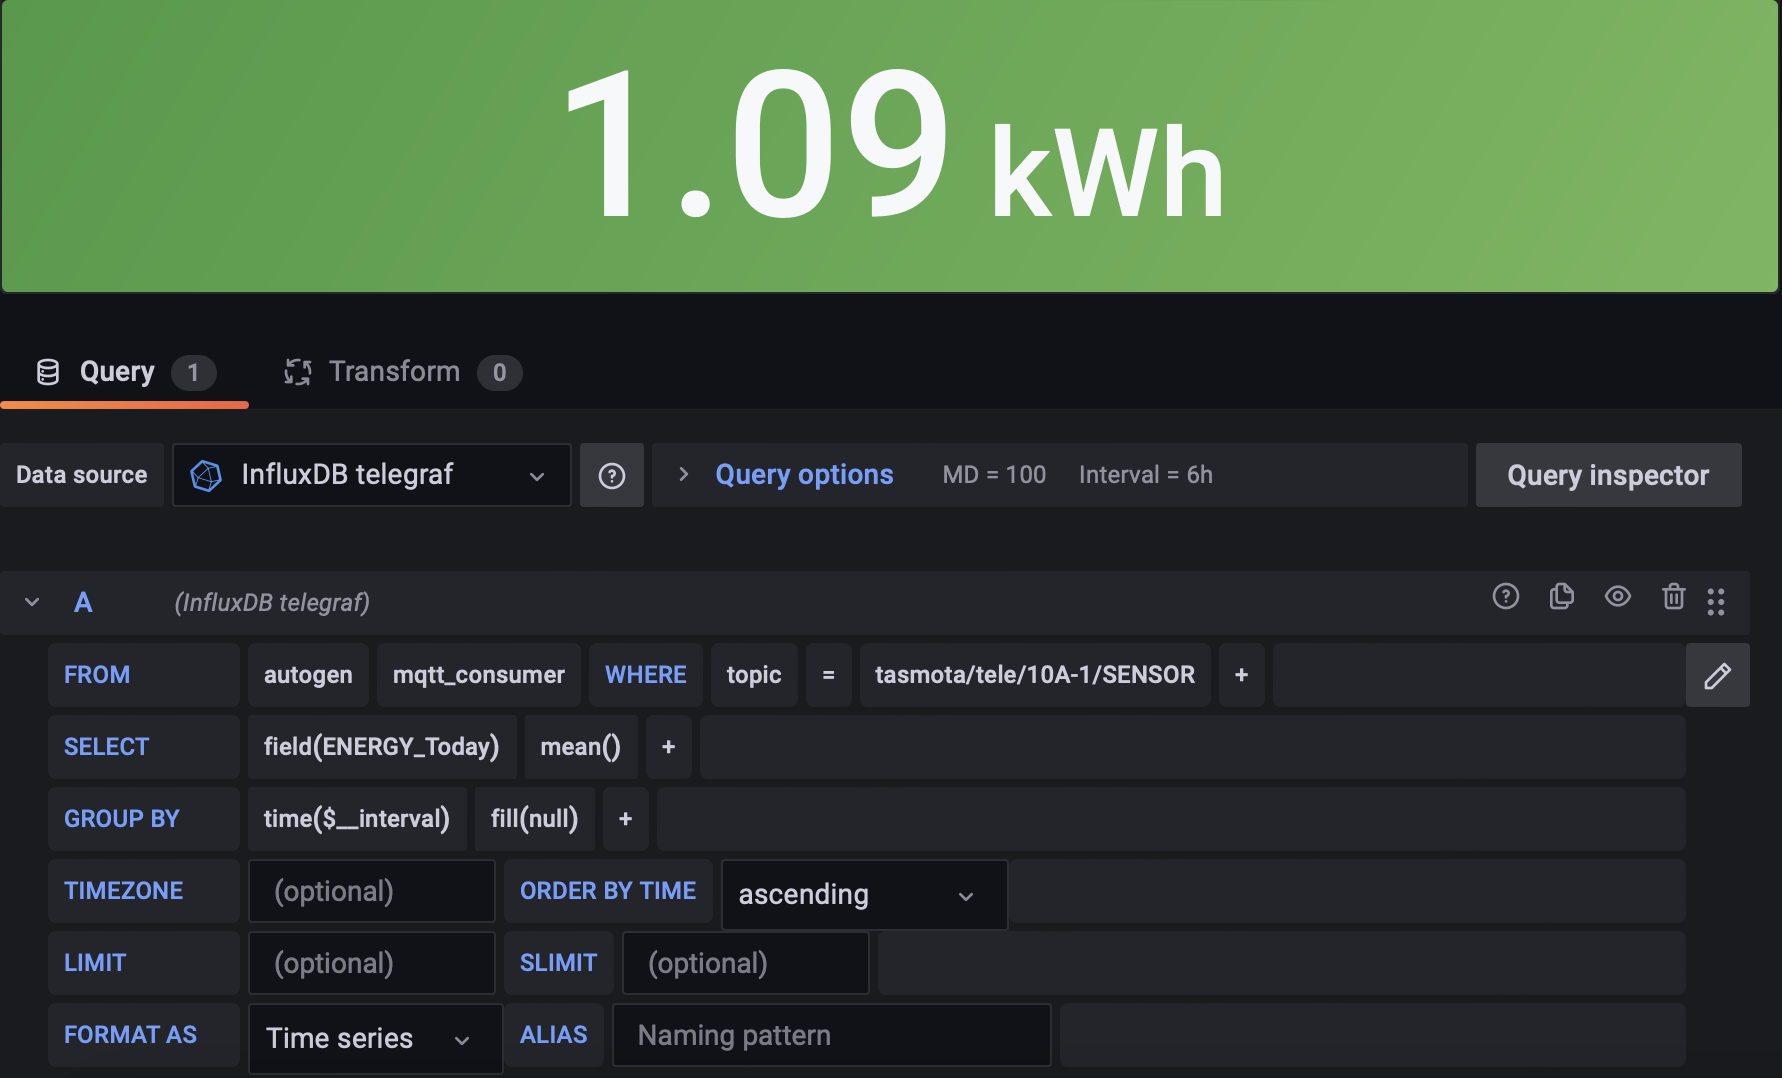
In Grafana I’ve added a new datasource, pointing to the influxdb table I’ve created for the telegraf import. All of the data posted to the watched MQTT queue is now consumed by Telegraf and is written to influxdb. Here’s an example for my use case with the Tasmota power plugs and their energy consumption for the current day:
Conclusion
It was quite easy to get the MQTT data into influxdb. There’s even a MQTT datasource for Grafana, but it doesn’t support TLS (which I might want to add in the future). It also cannot transform data properly so telegraf seems to be the better option here.
My original approach was to use OpenHab, which fetched the Tasmota data from MQTT and stored it then in influxdb, but since I do not use it anymore I had to search for an alternative. Telegraf is most certainly a proper replacement for this task.