Introduction
I’ve recently stumbled over an article in the german magazine C’T about visualisations of your Fritz!Box’s connection. The solution looked quite boring and outdated, since it used MRTG for the graph creation.
A better solution
I’ve started searching for a better solution using Grafana, InfluxDB and my Raspberry Pi and found this great blog post. I’ve already explained how to install Grafana and InfluxDB in this post, so I’ll concentrate on the Fritz!Box related parts:
Installation of fritzcollectd
Start with the installation of fritzcollectd. It is a plugin for collectd.
sudo apt-get install -y python-pip
sudo apt-get install -y libxml2-dev libxslt1-dev
sudo pip install fritzcollectd
Creating a user account
Now create a user account in the Fritz!Box for collectd. Go to System, Fritz!Box-user and create a new user with password, who has access from internet disabled. The important part is to enable “Fritz!Box settings”.
Additionally make sure that your Fritz!Box is configured to support connection queries using UPnP. You can configure this under “Home Network > Network > Networksettings”. Select “Allow access for applications” as well as “Statusinformation using UPnP”.
Installation and configuration of collect
Next part is the installation and configuration of collectd:
sudo apt-get install -y collectd
sudo nano /etc/collectd/collectd.conf
Enable the python and network plugins by removing the hashtag
LoadPlugin python
[...]
LoadPlugin network
Scroll down till you’ll see the plugin configuration and configure the port and IP for collectd
 <Plugin network>
    Server "127.0.0.1" "25826"
 </Plugin>
Enable the python plugin and configure the module with the username and password of the user you’ve created. Make also sure to use the right address.
 <Plugin python>
    Import "fritzcollectd"

     <Module fritzcollectd>
        Address "fritz.box"
        Port 49000
        User "user"
        Password "password"
        Hostname "FritzBox"
        Instance "1"
        Verbose "False"
     </Module>
 </Plugin>
Changes to InfluxDB
Since you’ve already got a running InfluxDB, you’ll just need to enable collectd as data source:
sudo nano /etc/influxdb/influxdb.conf
Search for the [collectd] part and replace it with
[[collectd]]
  enabled = true
  bind-address = "127.0.0.1:25826"
  database = "collectd"
  typesdb = "/usr/share/collectd/types.db"
Reboot collectd and influx to activate the changes made
sudo systemctl restart collectd
sudo systemctl restart influxdb
Configure Grafana
Login to your grafana installation and configure a new datasource. Make sure to set the collectd database. If you’re using credentials for the InfluxDB, you can add them now. If you’re not using authentication you can disable the “With credentials” checkbox.
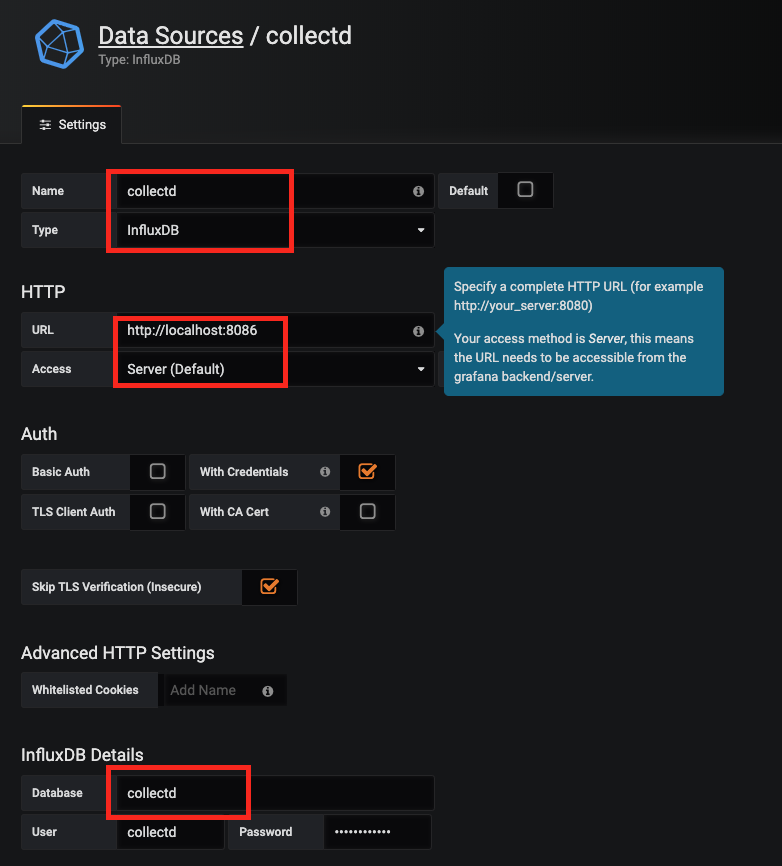
Check if your configuration is working by clicking on “Save & Test”.
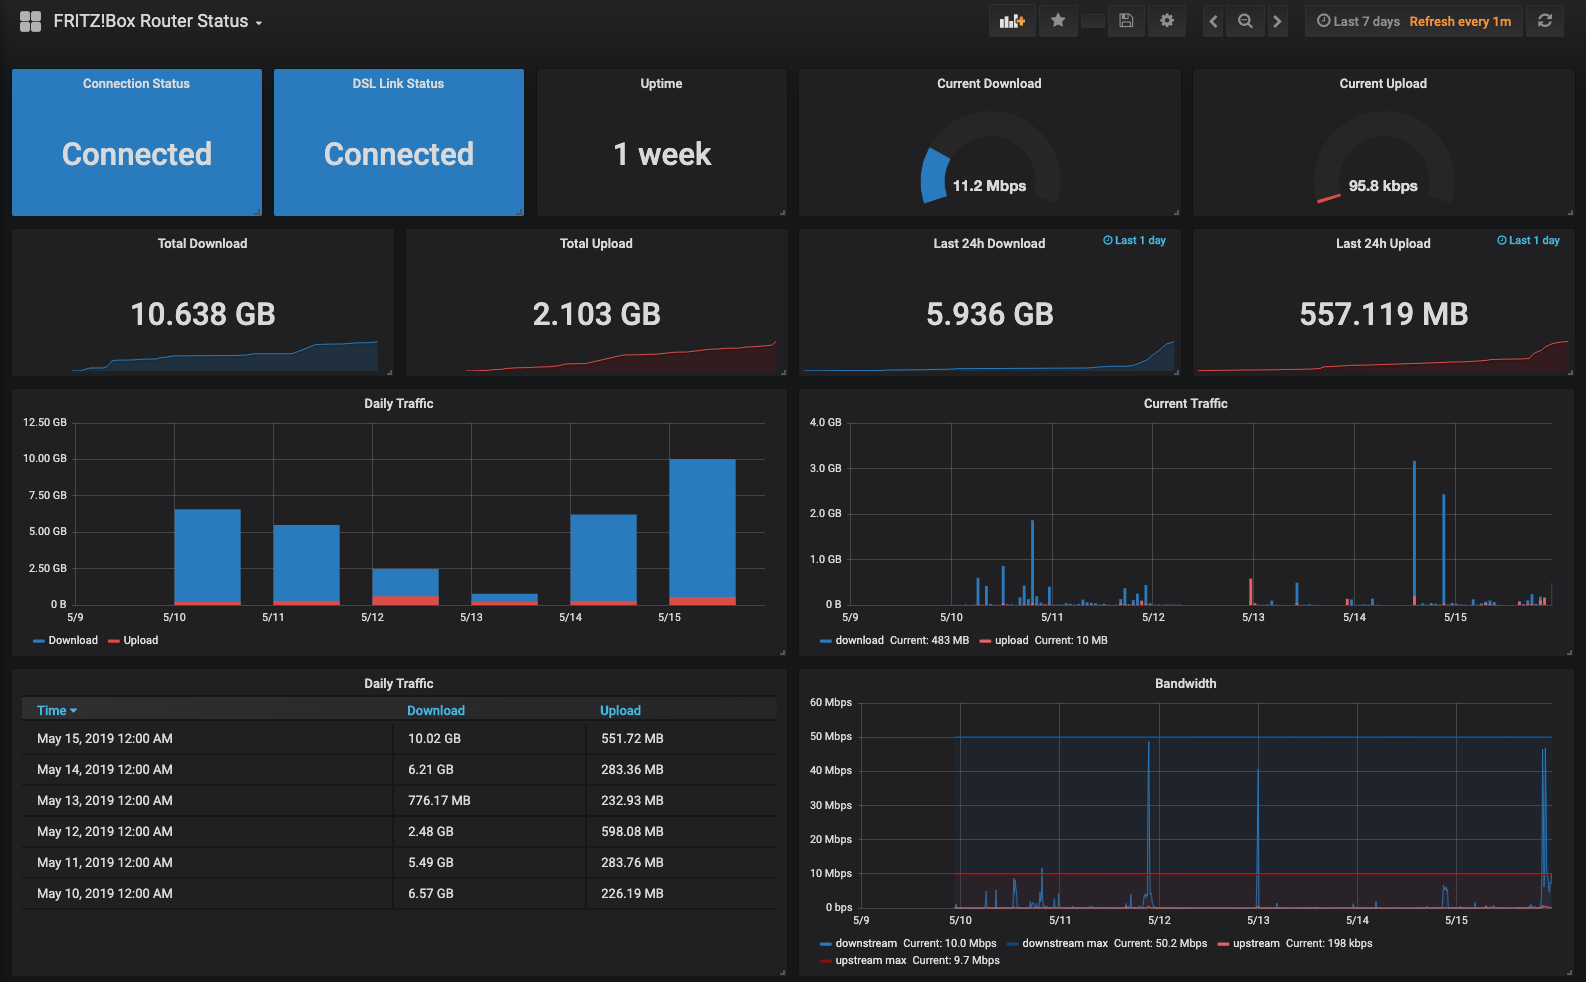
If everything worked, you can proceed to importing the Fritz!Box Dashboard from the Grafana.com dashboard. The ID is 713. Make sure to select the right InfluxDB during the import setup.
After clicking on import, you’ll should be able to see your new Dashboard. It might take a few minutes/hours until you’ve gathered enough data to properly display graphs.
Be aware though that if you start gathering this much data you’ll might end up with “insufficient memory” errors. You’ll might want to tweak your InfluxDB settings accordingly.